
Visualization Pipeline
Transform engineering CAD data into optimized, XR-ready assets with automated preparation that delivers fast, efficient results.
Powered by Theorem technology
The Visualization Pipeline is an enterprise-grade, fully automated solution for preparing and optimizing lightweight 3D data across multiple visualization domains.
It runs in batch mode, triggered by PLM workflows, integrates with CAD for direct export, or accepts drag-and-drop from the file system. However you load data, the pipeline automatically tessellates geometry and optimizes it for real-time use. It retains product structure, metadata, and animation data, making it ideal for XR, CGI, simulation, web visualization, and other applications that require efficient, structured 3D content.

Benefits in Brief
Fully Automated CAD Processing
Reduce manual activity whilst maximising visualization performance and quality.
PLM Integration
Fully integrate into your PLM processes with minimal effort and cost.
User Authentication
Manage data access with single sign-on (SSO) and user authentication aligned to company standards.
Job Scheduling
Use computing resources efficiently, helping control costs.
User-Defined Reporting
Gain insight into license usage, data consumption and performance.

Powered by Theorem technology
Powered by Theorem technology, the Visualization Pipeline is built on 30+ years of expertise in CAD translation and visualization.
The Visualization Pipeline includes fully automated processes to optimise the data for re-use; reducing polygons where necessary, shrink wrapping the data to remove non visible surfaces, eliminating unwanted data, or simplifying product structure to reduce data size. This ensures it provides high quality, high performance 3D content for XR or other Data Visualization use cases.
All processes are fully configurable and automated, with no manual intervention required. It can be installed on the Cloud or on-premises.
Being an enterprise-ready solution, the Visualization Pipeline can be fully integrated into your PLM processes with minimal effort and cost. PLM integration means you have a fully managed solution for XR content creation, eliminating duplication of data and ensuring data conformance to IT policies.
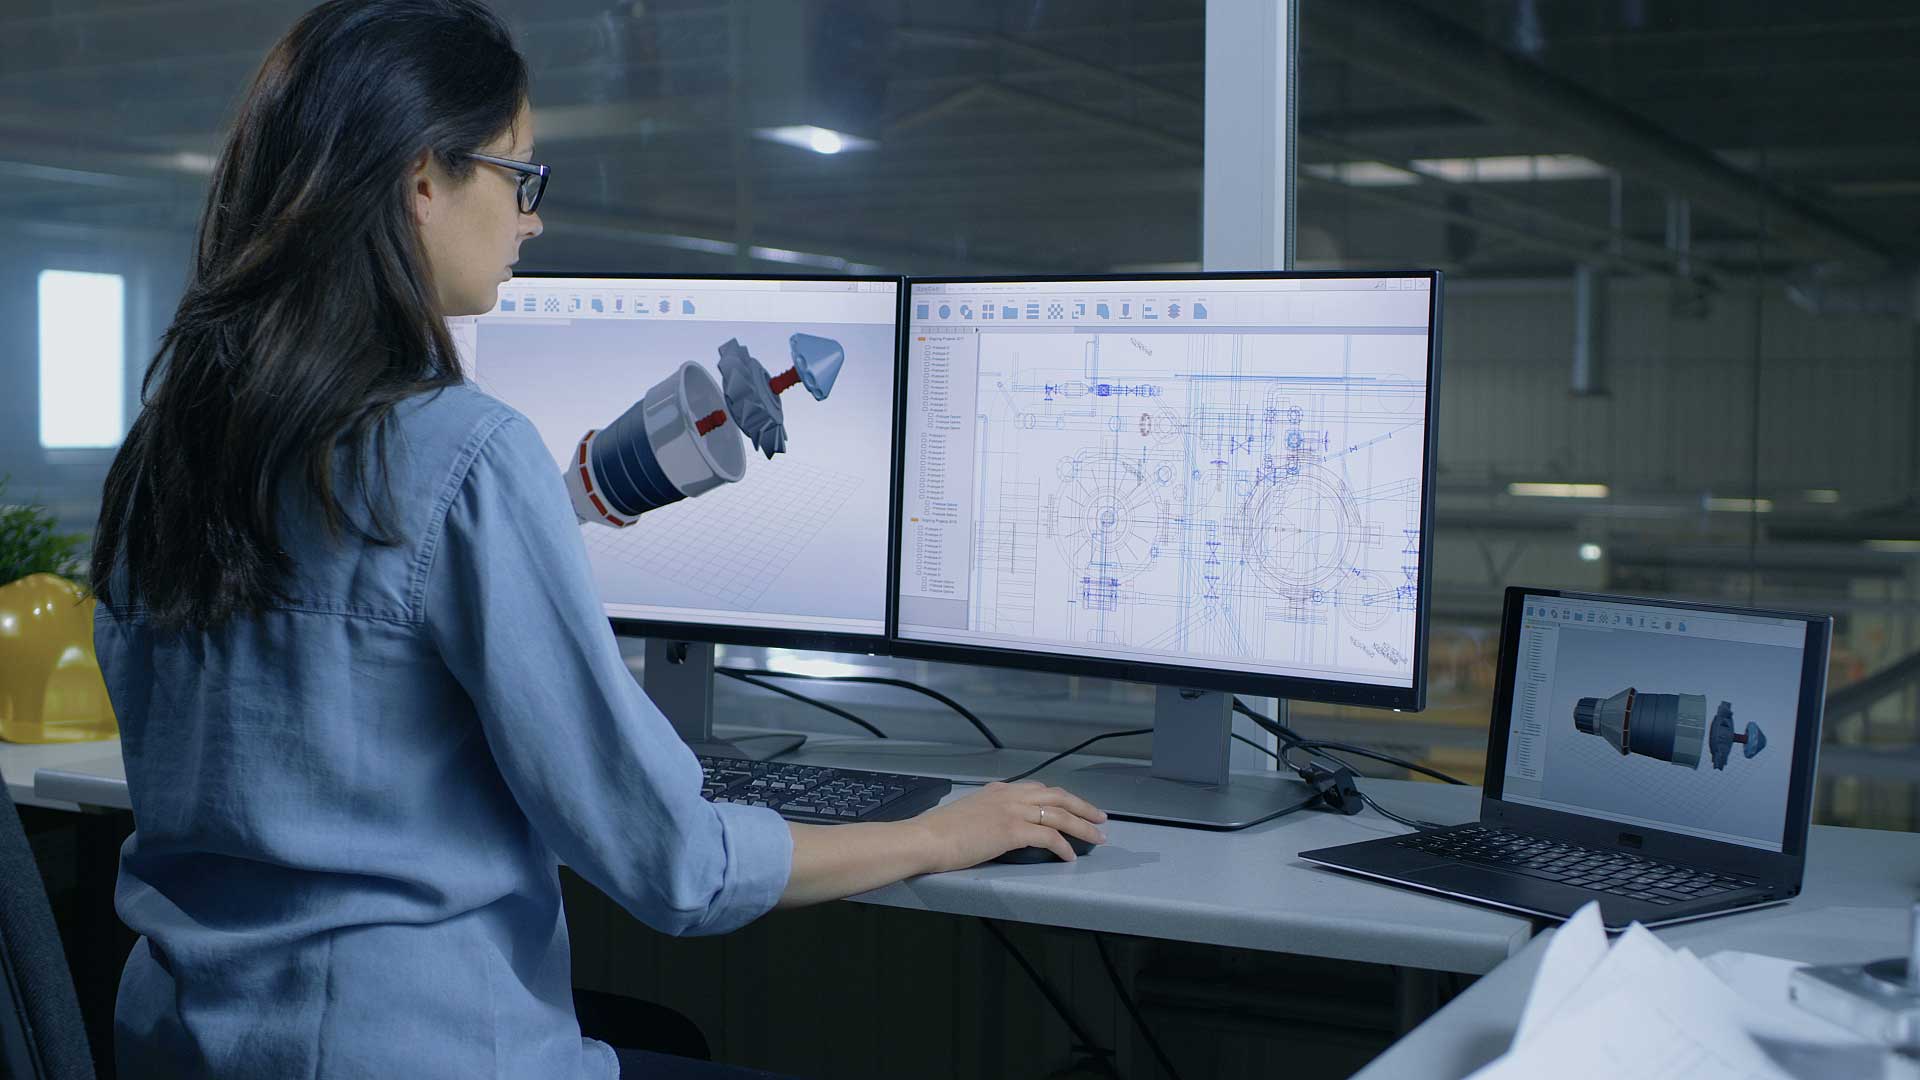
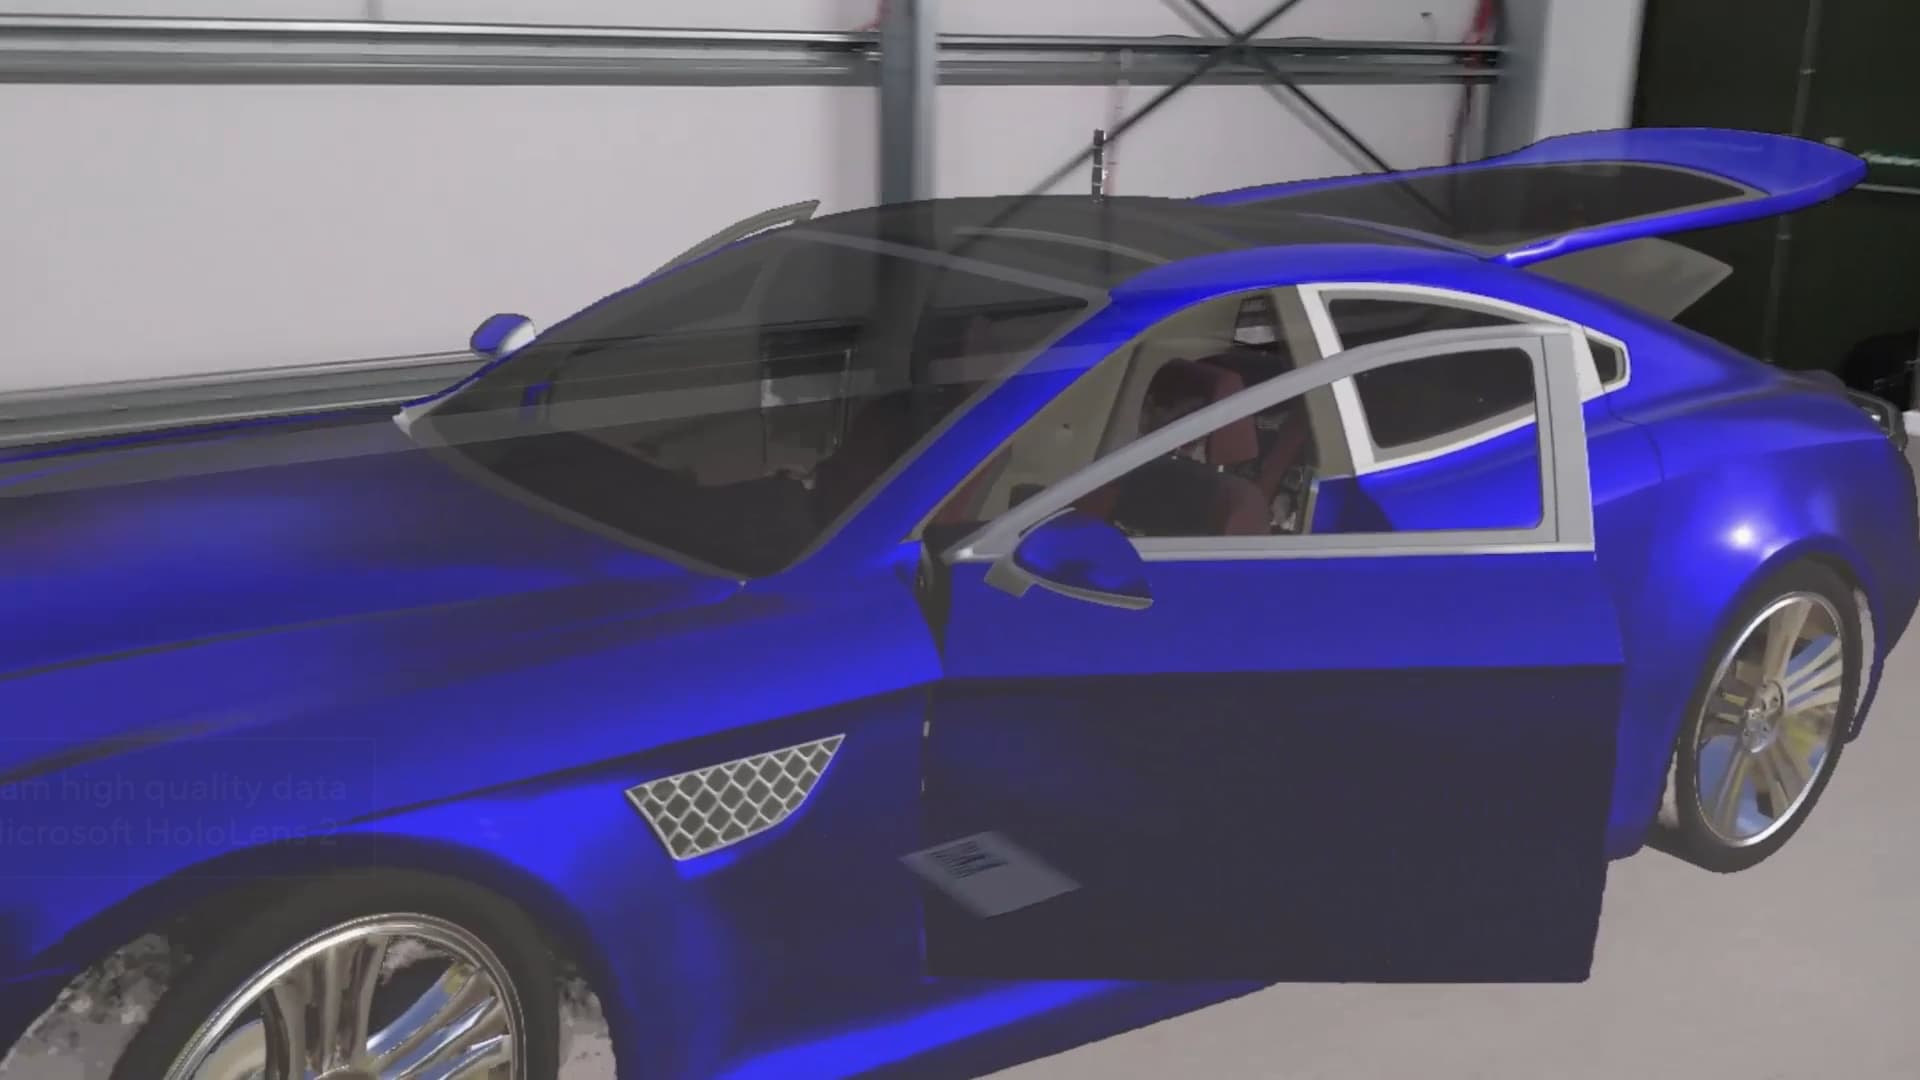
The Visualization Pipeline enables you to take source 3D data, whether from MCAD, AEC CAD, scanned data, ISO/ANSI standards such as STEP and JT, lightweight visualization formats like 3D XML and Creo View, or neutral formats such as FBX and glTF, and create 3D content in a fully automated process for use in XR experiences.
Data Optimization Methods
Automatically prepare and deliver high quality, performance ready data to meet your data preparation objectives faster, cleaner and with less manual effort. The Visualization Pipeline provides several optimization methods, including:
Shrink Wrapping
Shrink Wrapping creates a clean outer shell of your 3D model by keeping only the parts visible from the outside. It removes hidden internal pieces that aren’t needed for many visual projects, making the file smaller and faster to load. This is ideal for data visualization workflows where internal detail isn’t required.
Part Culling
Part Culling helps simplify your 3D model by removing smaller parts that aren’t important. This clears up clutter and makes the file smaller and easier to work with. It’s especially useful when internal or minor parts don’t matter, such as in factory layouts where spatial assessments are more important than tiny model details.
Decimation
Model Decimation (tessellation) helps your 3D data run faster by simplifying the polygons in your model. It reduces the number of triangles, making the file lighter and quicker to load. You can choose how much detail to keep; less detail means faster performance. It’s great for XR, web, simulation, and visual projects where speed matters more than precision.
Assembly Structure
Boost performance by collapsing complex assembly tree structures or combining multiple nodes into a single part. This can be effective when your source data has a complex assembly tree structure and you want to improve the speed and clarity.
FAQs about the Visualization Pipeline
Why should I use the Visualization Pipeline?
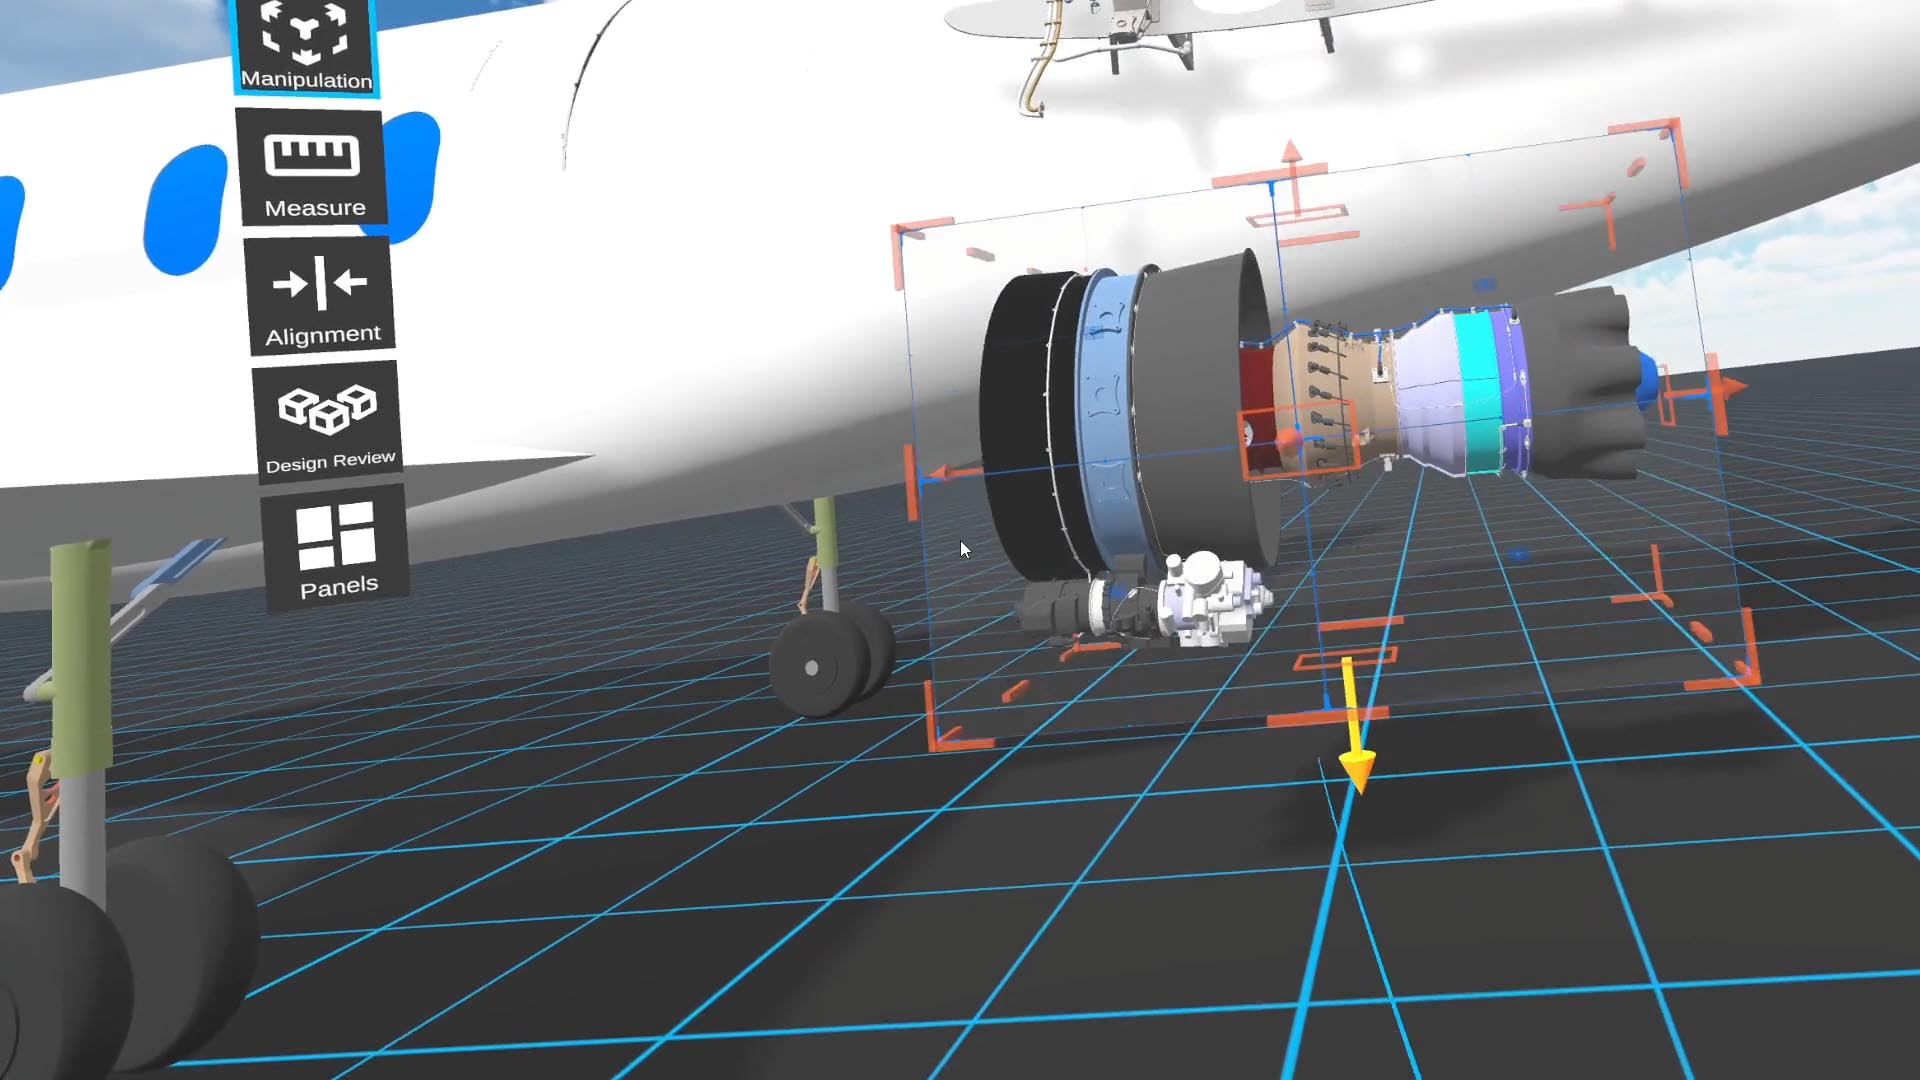
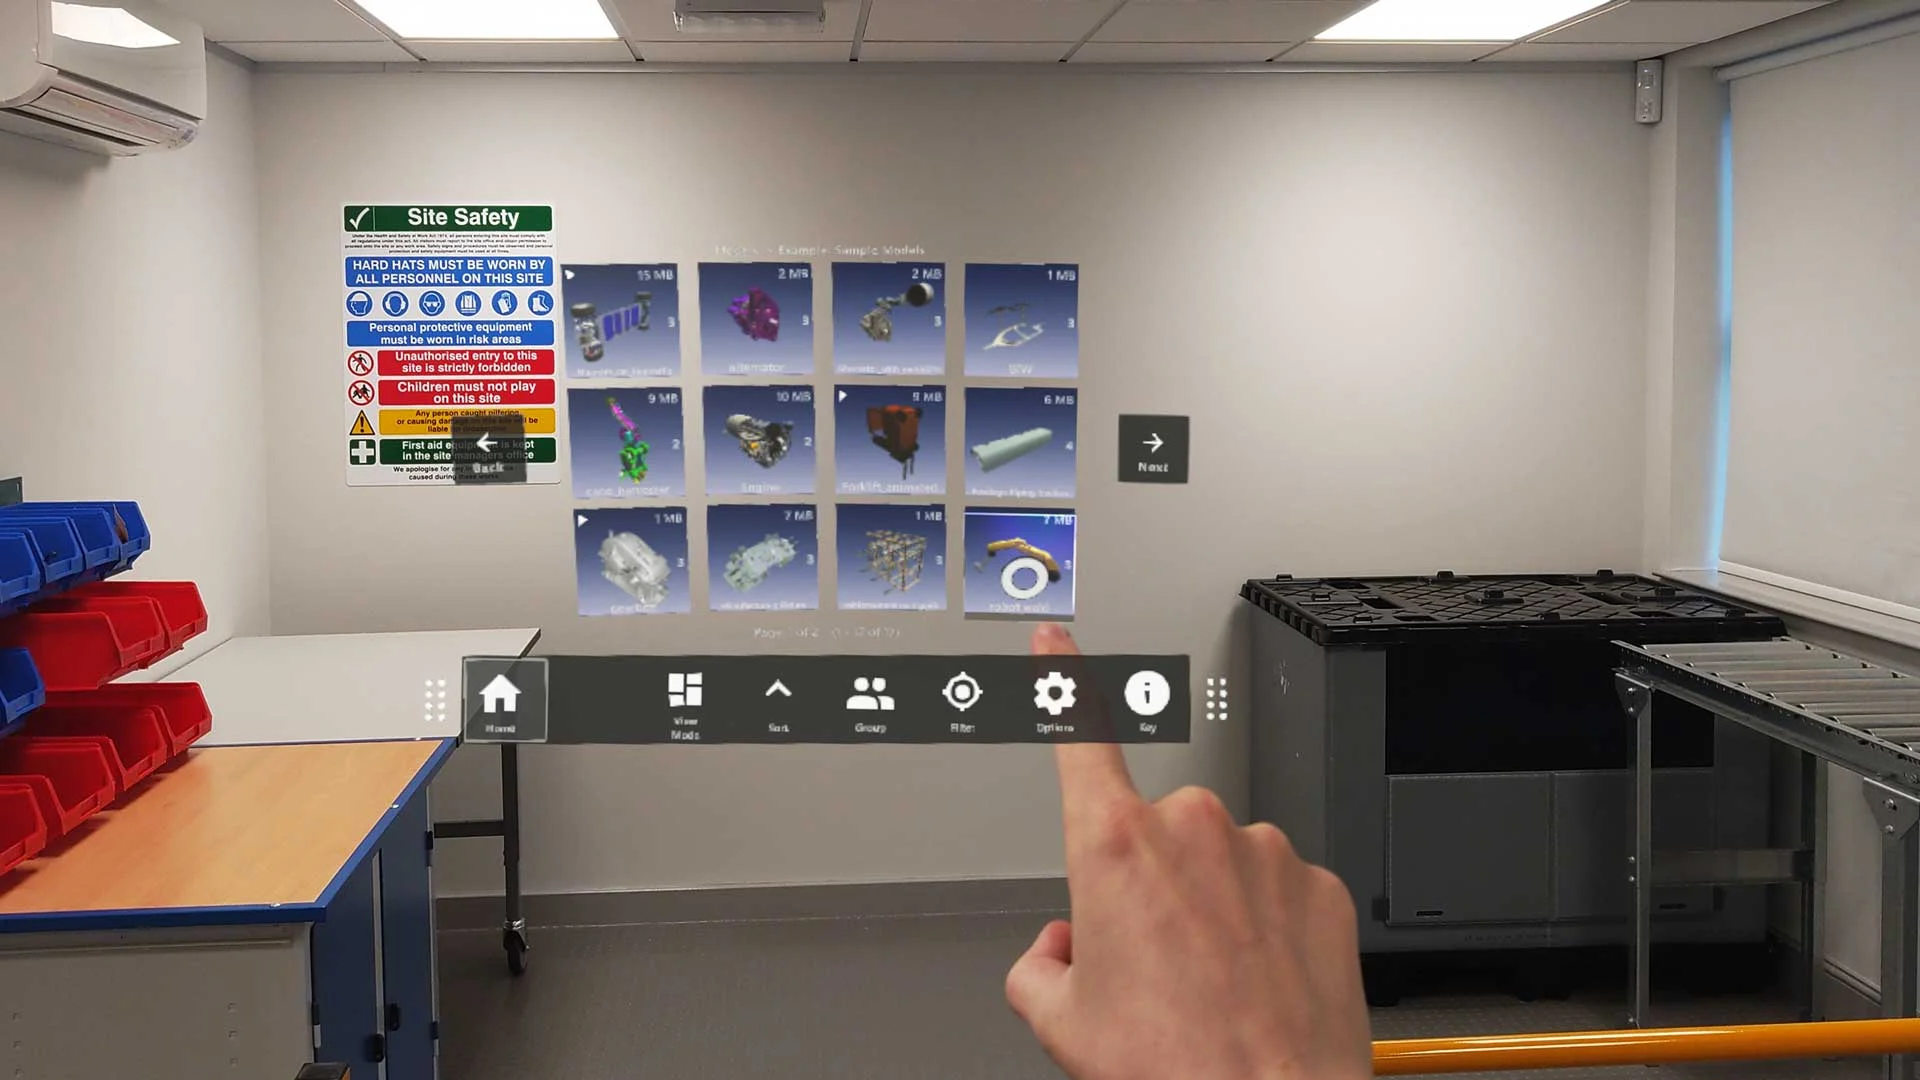
XR devices are only as valuable as the data they present. SpinFire's Visualization Pipeline transforms engineering CAD data into optimized, ready to use assets for XR applications without manual effort.
Built on Theorem technology, with 30+ years of experience in CAD translation and visualization, the pipeline is an enterprise grade solution that automates content creation for use in SpinFire XR experiences, as well as custom Unity and Unreal Engine workflows. The Visualization Pipeline is scalable, flexible, and production ready so your teams can focus on outcomes, not manual data preparation.
Does the Visualization Pipeline support SSO?
Yes. The Visualization Pipeline supports single sign on (SSO) and user authentication to ensure workflows and data access are managed, ensuring control of data. Being process centric ensures consistent high quality data is created conforming to company standards.
Can I track and manage license usage?
Yes. A dashboard feature lets you track key metrics from the Visualization Pipeline server, including data types uploaded, upload times, file sizes, and more.
Management reports can be created on license allocation, data consumption, and performance metrics to help control IT costs and optimize computing resources.
Is quads support available for FBX files?
Yes. FBX users can take advantage of ultra-lightweight data optimisation with quads support.
By using quads in your models, this reduces the polygon count and file size for downstream workflows, improving the performance and speed at the expense of the detail and quality of the model. This enables you to get a basic representation of your data, which is great for XR experiences such as Factory Layout.
Is material mapping supported for XR?
Yes, SpinFire XR users can use material mapping to ensure a more consistent colour pallet for models, or take advantage of high quality application specific materials; supporting output from any CAD format to VRED, FBX and glTF.
Does the TVP extract metadata?
Yes. When using the TVP to prepare CAD data for XR, metadata can be extracted, enabling review of the properties attached to nodes in the model's assembly structure.
The information can also be made available when viewing the model in SpinFire XR experiences.
Related Insights on Extended Reality (XR)
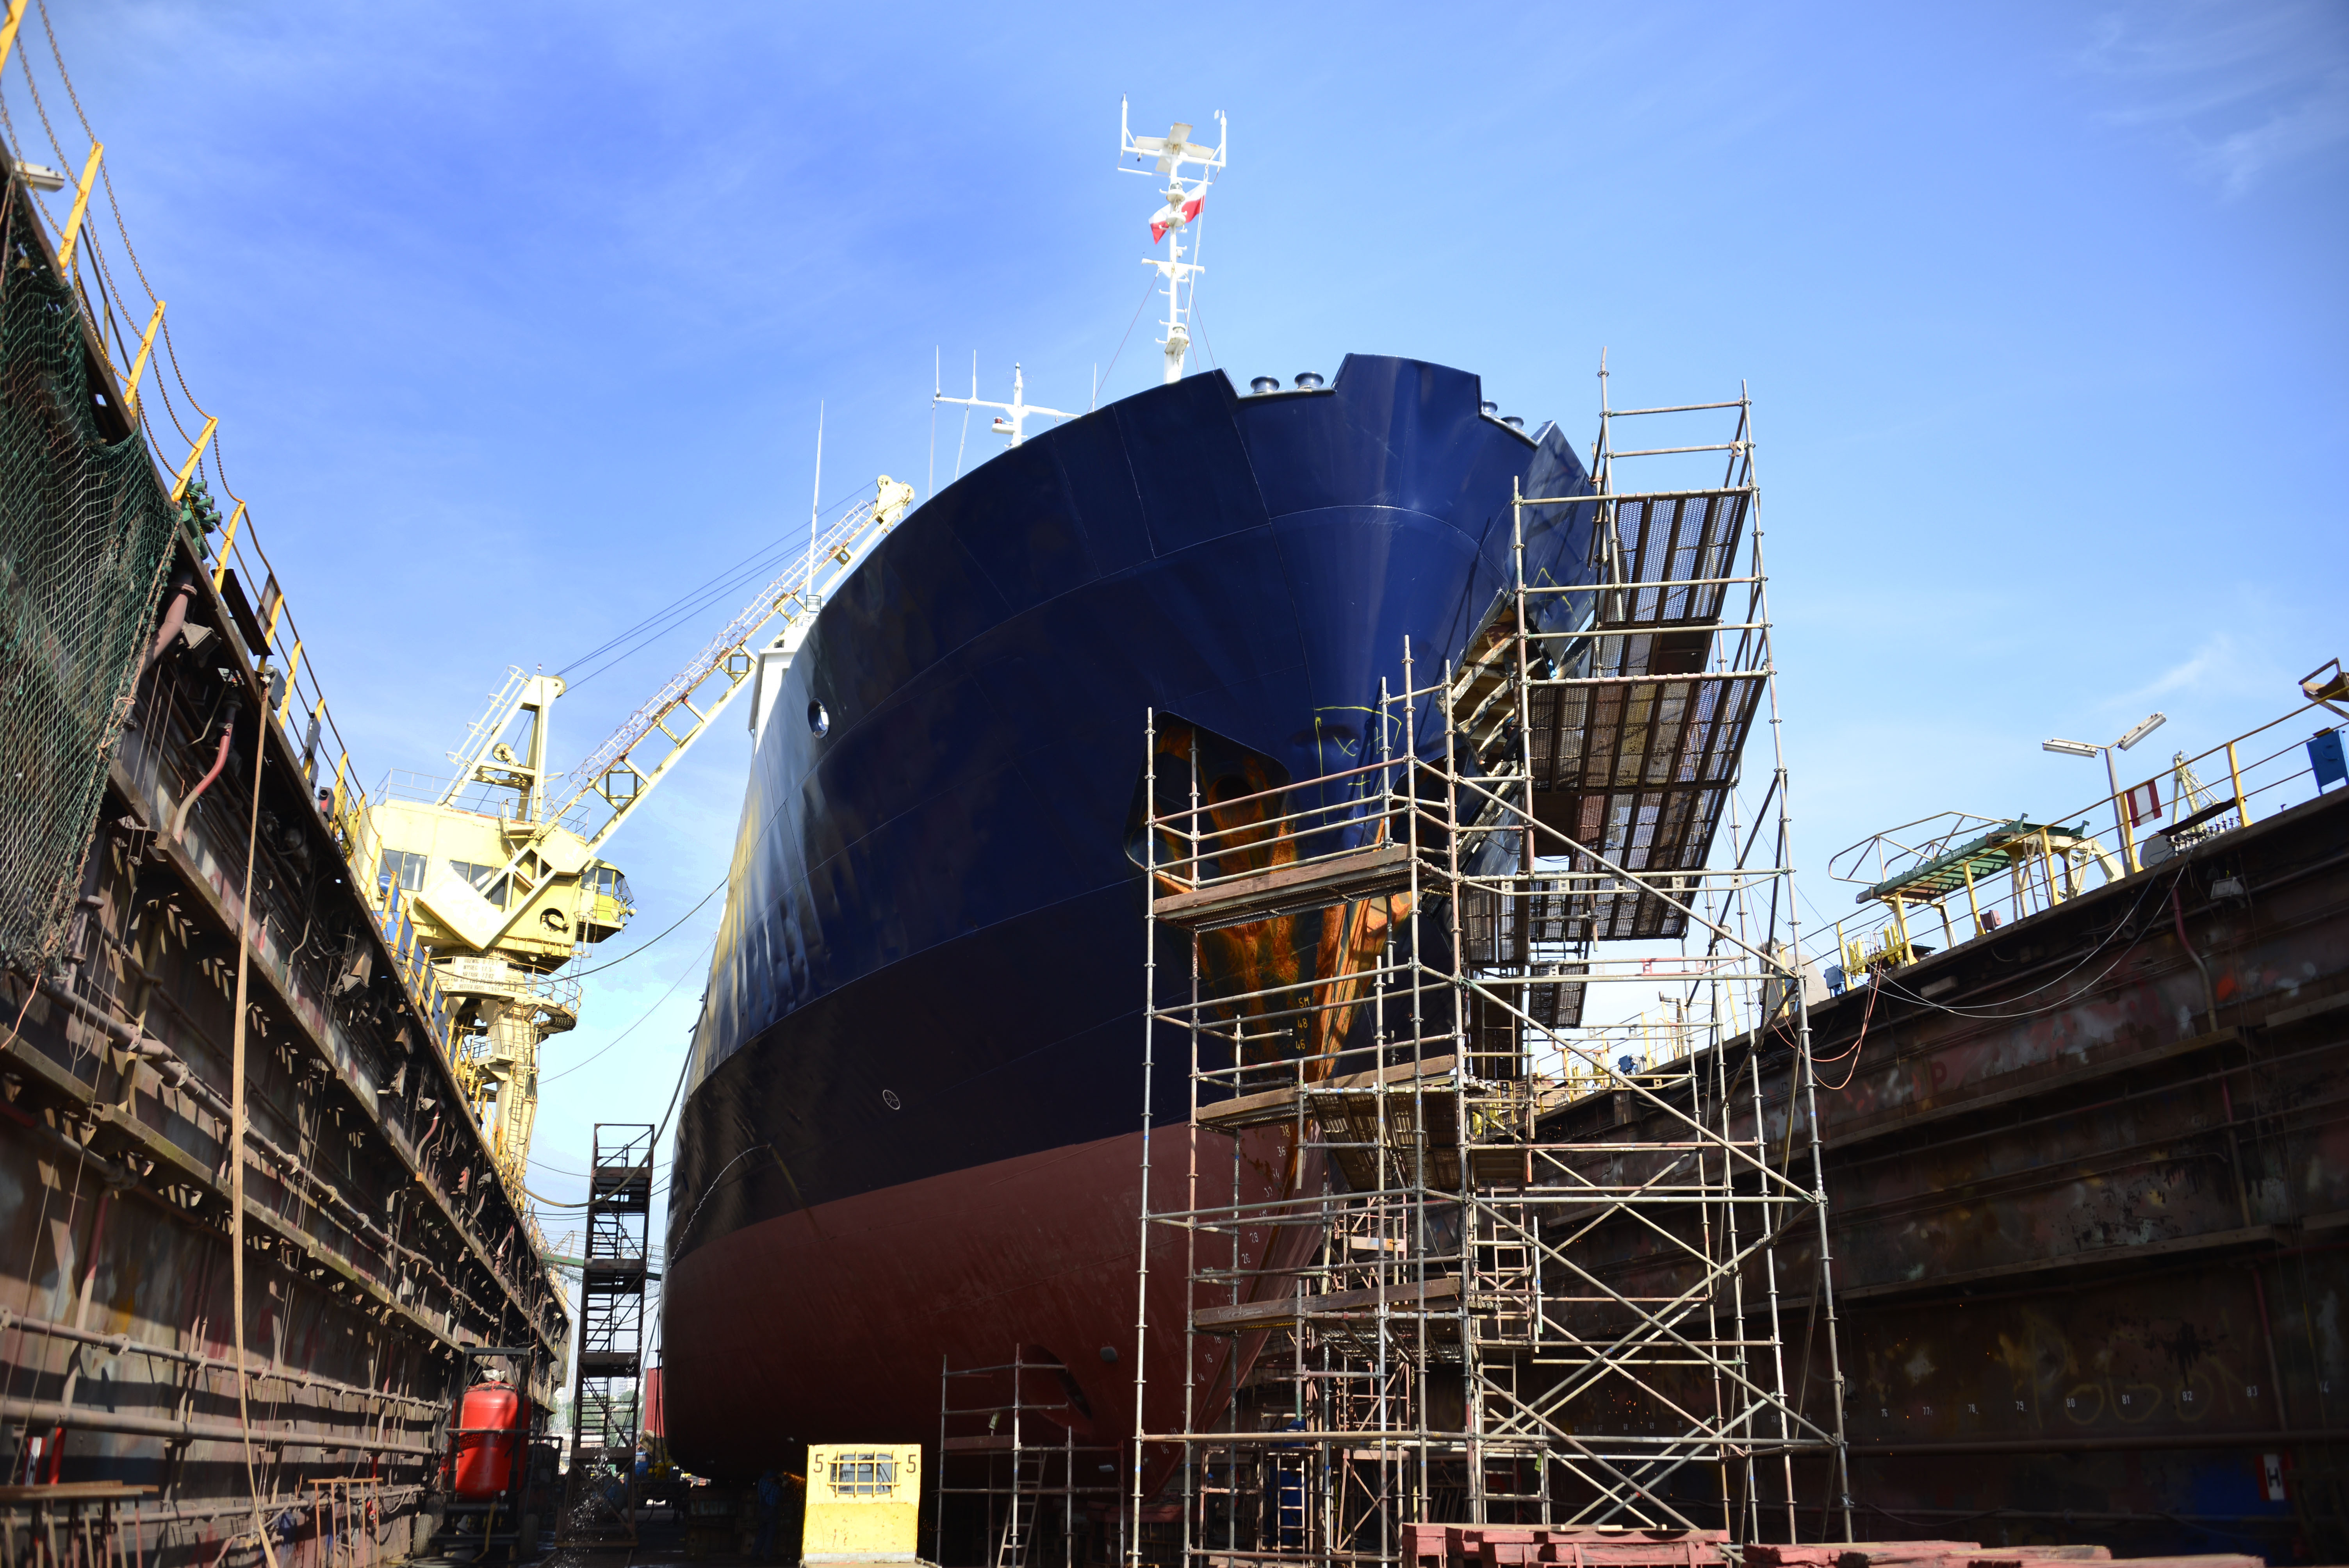
How can Extended Reality be Used in Shipbuilding
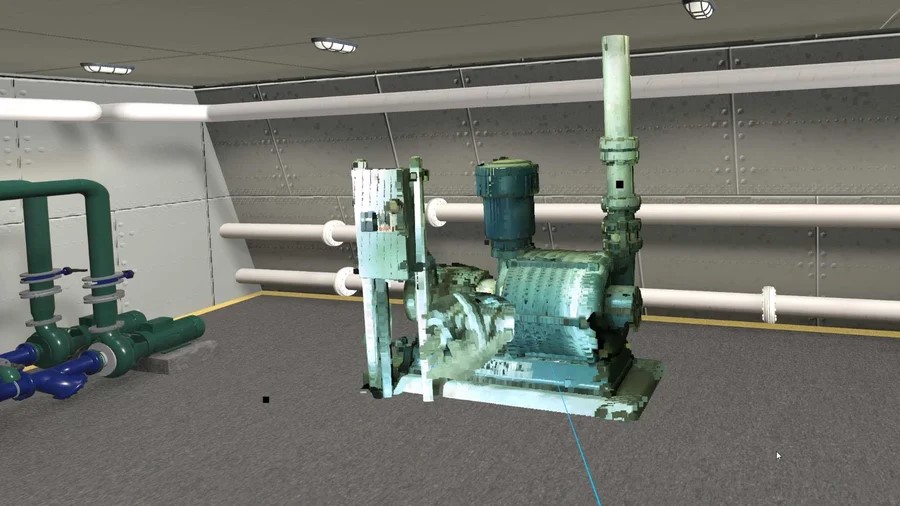
How Can You Use Scan Data in Extended Reality

Join Us at Advanced Engineering 2025